How Google Maps Knows You’ll Be Stuck Before You Are
The red line was already there before you checked. Google Maps had flagged your commute as slow six minutes before you opened the app — before you were even running late.
Every morning, millions of people glance at their phones, see a river of red, and groan. But that map isn’t just showing you what’s happening — it’s telling you what’s about to happen. The machinery behind that quiet prediction is stranger and more ambitious than almost anyone realizes, and it took me an embarrassingly long time to appreciate just how deep it actually goes.
Key Facts
- Google Maps layers anonymous location signals, historical patterns, real-time incident reports, and transport-agency speed data across more than 220 countries and territories, processing millions of location signals per second as of 2023.
- In 2020, Google DeepMind partnered with Google Maps to deploy AI-driven traffic prediction that improved ETA accuracy by up to 50% in some cities.
- Google acquired Waze in 2013 for approximately $1.1 billion, adding over 140 million monthly active users and a community-reporting model to the data network.
- Google Maps generates traffic forecasts accurate up to an hour in advance using machine learning models trained on trillions of data points.
- A 2022 report credited the system with helping avoid 3.5 billion kilometers of unnecessary driving annually, roughly four times the distance to Saturn and back.
In short: Google Maps traffic prediction works less like a sensor and more like a planetary memory. It layers anonymous location signals from across 220-plus countries with years of historical patterns, generating forecasts accurate up to an hour ahead. A 2020 DeepMind partnership boosted ETA accuracy by up to 50%, turning crowds into infrastructure.
How Google Maps Traffic Prediction Actually Works
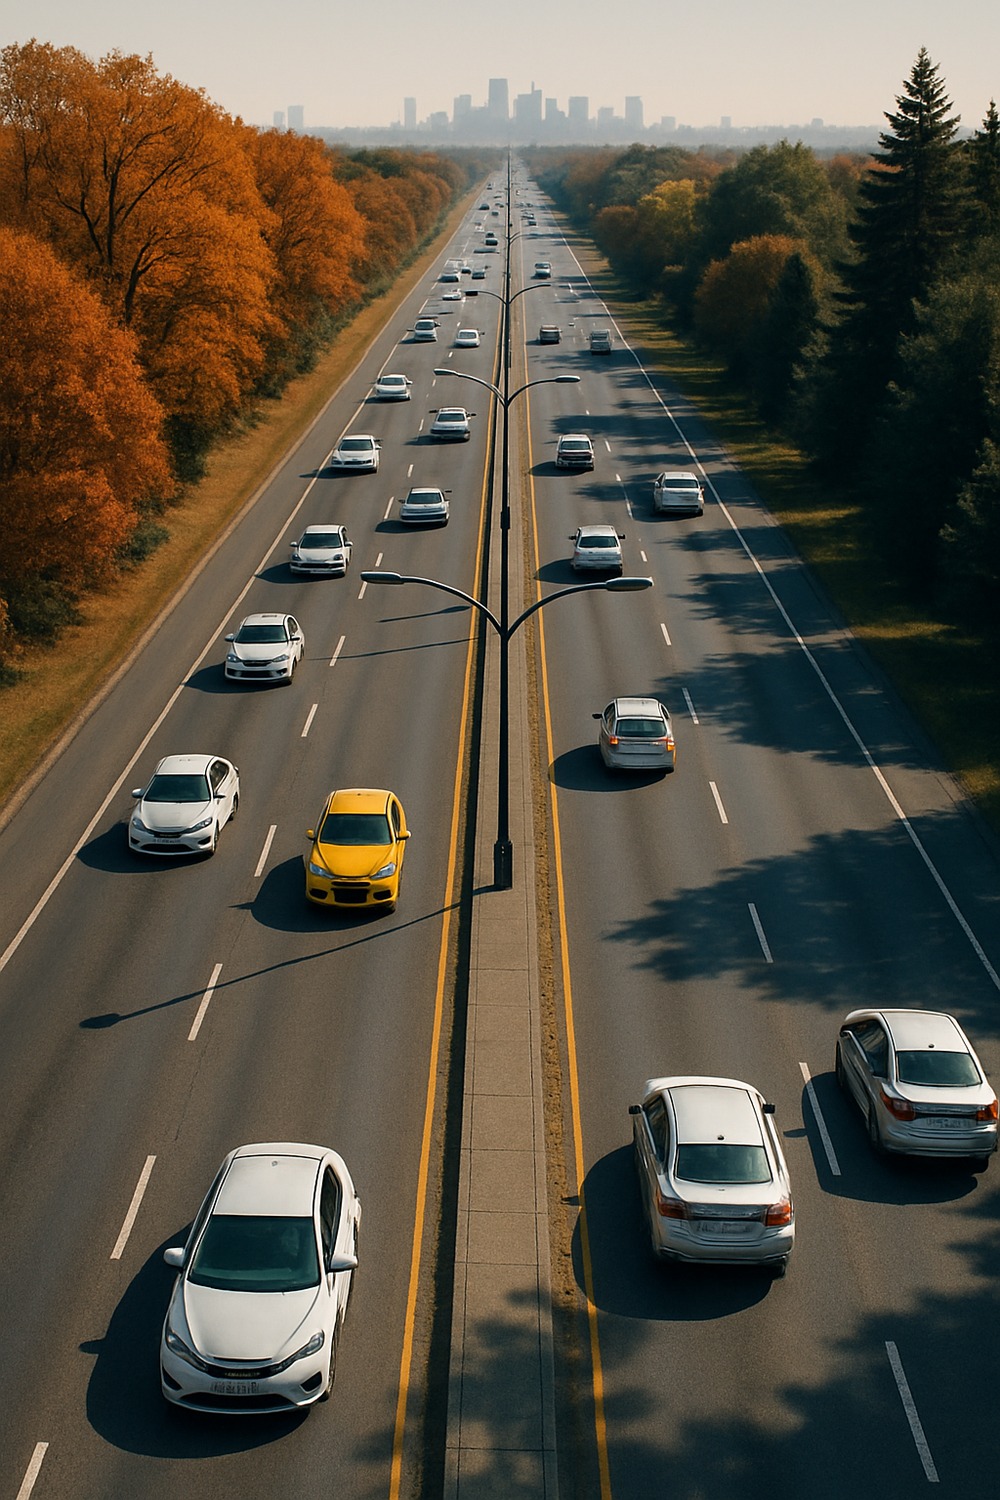
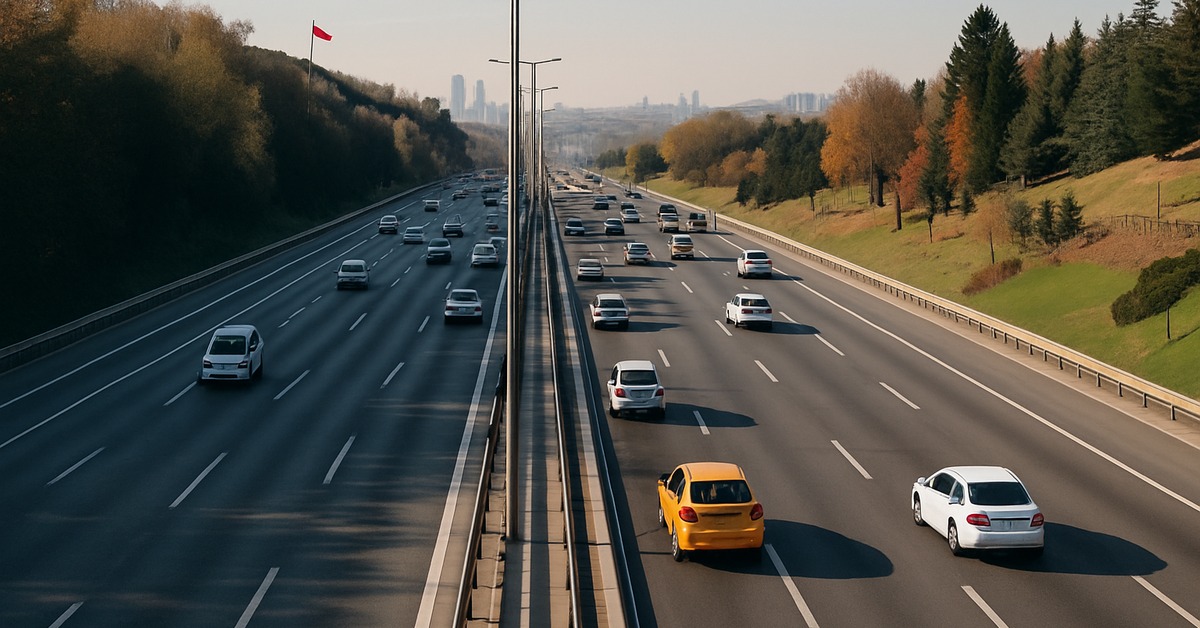
Google Maps doesn’t rely on a single clever trick. It layers anonymous location signals from Android phones, historical traffic patterns, real-time incident reports, and speed data from local transport agencies across more than 220 countries. Traffic flow researchers have studied urban congestion for decades, but what Google built is categorically different — it’s a living archive that doesn’t just observe traffic, it metabolizes it. Think of it like the difference between a photograph of a river and a model that understands where the river wants to go next.
Every time you drive anywhere with your phone in your pocket, you become one data point in a planetary nervous system. You’re feeding the machine. Most people don’t realize they’ve been teaching this system for years.
The Algorithm Remembers Tuesday Morning in June
Google Maps doesn’t just know what traffic looks like right now — it knows what it looked like on this exact type of day, in this exact city, going back years. A rainy Wednesday in Seattle registers differently than a sunny Friday in Miami, and the system has learned to tell them apart. According to Google’s own engineering blog, the system uses machine learning models trained on trillions of data points to generate forecasts accurate up to an hour in advance. That’s not GPS doing its job. That’s pattern memory operating at something close to civilizational scale.
A Tuesday morning in June in São Paulo carries certain rhythms — school pickups, office rush, that peculiar slowdown near the Paulista Avenue corridor. The algorithm has absorbed all of it.
It’s not guessing. It’s remembering.
The Ghost Data You’ve Never Thought About
Google Maps traffic prediction runs on what engineers quietly call “anonymized aggregate location data.” Which is a very calm phrase for something genuinely vast. Every Android device, every Maps user with location sharing enabled, every Waze contributor is sending micro-signals about speed and position — hundreds of millions of data points per minute, from every corner of the globe.
Here’s the part that kept me reading for another hour: even at 3 a.m., when the roads are empty, the system is still collecting. It’s logging the silence. Building a model of what “normal quiet” looks like so it can recognize “abnormal quiet” later.
Midnight on the Golden Gate Bridge tells the system something. So does rush hour gridlock in Lagos. Both become reference points. Both become memory.
When the Prediction Engine Gets It Eerily Right
There are moments when Google Maps feels less like an app and more like something that understands cities the way a longtime resident does. It warns you about a slowdown before any news outlet has reported an accident. It reroutes you around a bottleneck that hasn’t fully formed yet. This isn’t some kind of oracle — it’s the result of identifying early-warning signals that human dispatchers would miss entirely. A cluster of phones suddenly dropping speed across a half-mile stretch? That’s a car accident forming. The system sees it in seconds.
Sometimes the system is right before the cause even exists. It predicts congestion based on historical probability alone — it knows a stadium will empty at 10:15 p.m. on a Sunday because it’s seen it happen 200 times before.
That is not prediction. That is memory wearing the costume of prediction.
The Cities That Taught the Algorithm the Most
The most chaotic cities on Earth turn out to be the most valuable teachers. São Paulo — consistently ranked among the world’s worst for traffic — has given Google Maps an extraordinary education in gridlock dynamics. Tokyo’s near-perfect expressway system taught it what optimal flow actually looks like. London’s congestion zones showed how policy changes ripple through road networks in real time. Mumbai’s monsoon seasons demonstrated how weather interacts with infrastructure in ways that pure traffic models simply can’t anticipate.
The algorithm doesn’t have a favorite student. A city that functions perfectly and a city that barely functions at all are both irreplaceable — because each reveals something the other can’t.
By the Numbers
- 220+ countries and territories feeding data in, millions of location signals processed per second as of 2023 — a scale no previous mapping system came close to achieving.
- In 2020, Google DeepMind partnered with Google Maps to deploy AI-driven traffic prediction that improved ETA accuracy by up to 50% in some cities, according to Google’s official announcement.
- Waze — acquired by Google in 2013 for approximately $1.1 billion — brought a community-reporting model that now integrates directly with Maps, adding over 140 million monthly active users to the data network. That acquisition looks different in retrospect.
- 3.5 billion kilometers of unnecessary driving avoided annually, per a 2022 report. That’s roughly the distance to Saturn and back. Nearly four times.
Field Notes
- Google Maps adjusts predictions for local holidays, major sporting events, and recurring weekly patterns — a Friday in August and a Friday in January in the same city are treated as genuinely different problems.
- The system doesn’t only learn from cars. Pedestrian movement, cycling data, bus GPS feeds, and anonymized transit app usage all feed into the model. Traditional traffic sensors miss multimodal congestion almost entirely.
- In parts of sub-Saharan Africa, Southeast Asia, and South America, Google Maps has become the primary source of real-time traffic data — because official sensors were never installed in the first place. The crowd became the infrastructure.
Why This Changes How We Think About Cities
Google Maps traffic prediction has quietly become one of the most detailed continuous records of human movement ever assembled. Urban planners in cities like Bogotá and Jakarta now use Google’s aggregated data to identify where new roads are needed, where signal timing is broken, where pedestrian infrastructure is quietly failing. The system isn’t just serving individual drivers anymore — it’s informing billion-dollar infrastructure decisions. That shift happened without most people noticing.
What started as a navigation tool is becoming something closer to a nervous system for the modern city. Not just observing us, but shaping the decisions that shape us back.
The road you take tomorrow may already have been influenced by data you generated last year.
A red line on your phone is the visible tip of an invisible ocean — years of human movement, compressed into a millisecond calculation. It knows your city’s rhythms better than most of its residents do. And it’s still learning, right now, from every car moving through every intersection on the planet.
We’ve handed something genuinely strange to an algorithm: the collective memory of how billions of people move through the world, every single day. Google Maps traffic prediction is no longer just a convenience — it’s a living portrait of urban civilization at scale. It knows when the city breathes. It knows when it chokes. Somewhere in that digital archive is a pattern that no human mind could hold alone. There’s more at this-amazing-world.com — and honestly, the next one is weirder.
Frequently Asked Questions
Q: How does Google Maps predict traffic before it happens?
Google Maps does not rely on a single trick. It layers anonymous location signals from Android phones, historical traffic patterns, real-time incident reports, and speed data from transport agencies across more than 220 countries. The system processes millions of location signals per second and uses machine learning models trained on trillions of data points to generate forecasts accurate up to an hour in advance, effectively remembering how a specific type of day behaves in a specific city.
Q: How much did Google’s DeepMind partnership improve traffic accuracy?
In 2020, Google DeepMind partnered with Google Maps to deploy AI-driven traffic prediction that improved ETA accuracy by up to 50% in some cities, according to Google’s official announcement. The system identifies early-warning signals human dispatchers would miss, such as a cluster of phones suddenly dropping speed across a half-mile stretch, which signals a car accident forming and can be detected within seconds.
Q: What role did Waze play in Google Maps traffic prediction?
Google acquired Waze in 2013 for approximately $1.1 billion, and its community-reporting model now integrates directly with Maps, adding over 140 million monthly active users to the data network. Waze contributors send micro-signals about speed and position, supplementing the anonymized aggregate location data Google collects. Together these feeds help the system credit roughly 3.5 billion kilometers of unnecessary driving avoided annually, per a 2022 report.
Illustrations are AI-generated. Article fact-checked and human-edited. Our editorial standards.