Greenland’s Ice Is Vanishing — And It’s Just the Beginning
Four point seven trillion tons — and that’s not a projection. That’s what’s already gone. Greenland ice sheet melting has erased that mass since 1992, a figure so geometrically large that the mind keeps sliding off it. But here’s the thing: the number isn’t the story. The acceleration is.
Scientists have been drilling, measuring, and transmitting data from Greenland’s frozen interior for decades. What they’ve found has steadily escalated from alarming to unprecedented. The ice sheet — covering roughly 1.7 million square kilometers, about three times the size of Texas — is losing mass at a rate that has no clear parallel in the modern record. The question isn’t whether this matters. It’s whether we understand how much it already has.
Key Facts
- The Greenland ice sheet has lost 4.7 trillion tons of ice between 1992 and 2023, per the IMBIE consortium in Nature, 2023.
- Greenland lost ice six times faster in the 2010s than in the 1990s, according to the IMBIE 2019 assessment.
- The ice sheet covers roughly 1.7 million square kilometers, about 80% of Greenland’s land surface and three times the size of Texas.
- The Atlantic Meridional Overturning Circulation has slowed to its weakest state in at least 1,600 years, per a 2021 Potsdam Institute study in Nature Geoscience.
- Complete melting of the Greenland ice sheet would raise global sea levels by up to 7.2 meters.
In short: Greenland ice sheet melting has erased 4.7 trillion tons of ice since 1992, losing mass six times faster in the 2010s than the 1990s per IMBIE data. The article traces cascading effects: a 1,600-year-low Gulf Stream, permafrost methane feedback, and sea-level projections exceeding one meter by 2100.
The Scale of Ice Loss Defies Easy Understanding
In 2019, the Ice Sheet Mass Balance Inter-comparison Exercise — known as IMBIE, a consortium of 89 scientists from 50 international organizations — published the most comprehensive assessment of Greenland’s ice loss ever compiled. Their findings, released in the journal Nature, confirmed that the Greenland ice sheet had shed ice six times faster in the 2010s than it did in the 1990s. Between 1992 and 2018, it lost 3.8 trillion tons. By the time that figure was updated to 4.7 trillion tons, the acceleration had already begun to outpace most mid-range climate models. That’s not a revision. That’s a warning embedded in the data itself.
What makes that number so hard to absorb is its compounding nature. Each ton of meltwater that reaches the ocean doesn’t just raise the sea level — it also freshens the North Atlantic, disrupting the density gradients that drive deep ocean circulation. The system is not isolated. It’s networked. A glacier retreating in western Greenland changes conditions in the Labrador Sea, which influences storm tracks over Ireland, which shifts rainfall patterns across continental Europe.
The ice isn’t disappearing quietly. It’s rewriting weather.
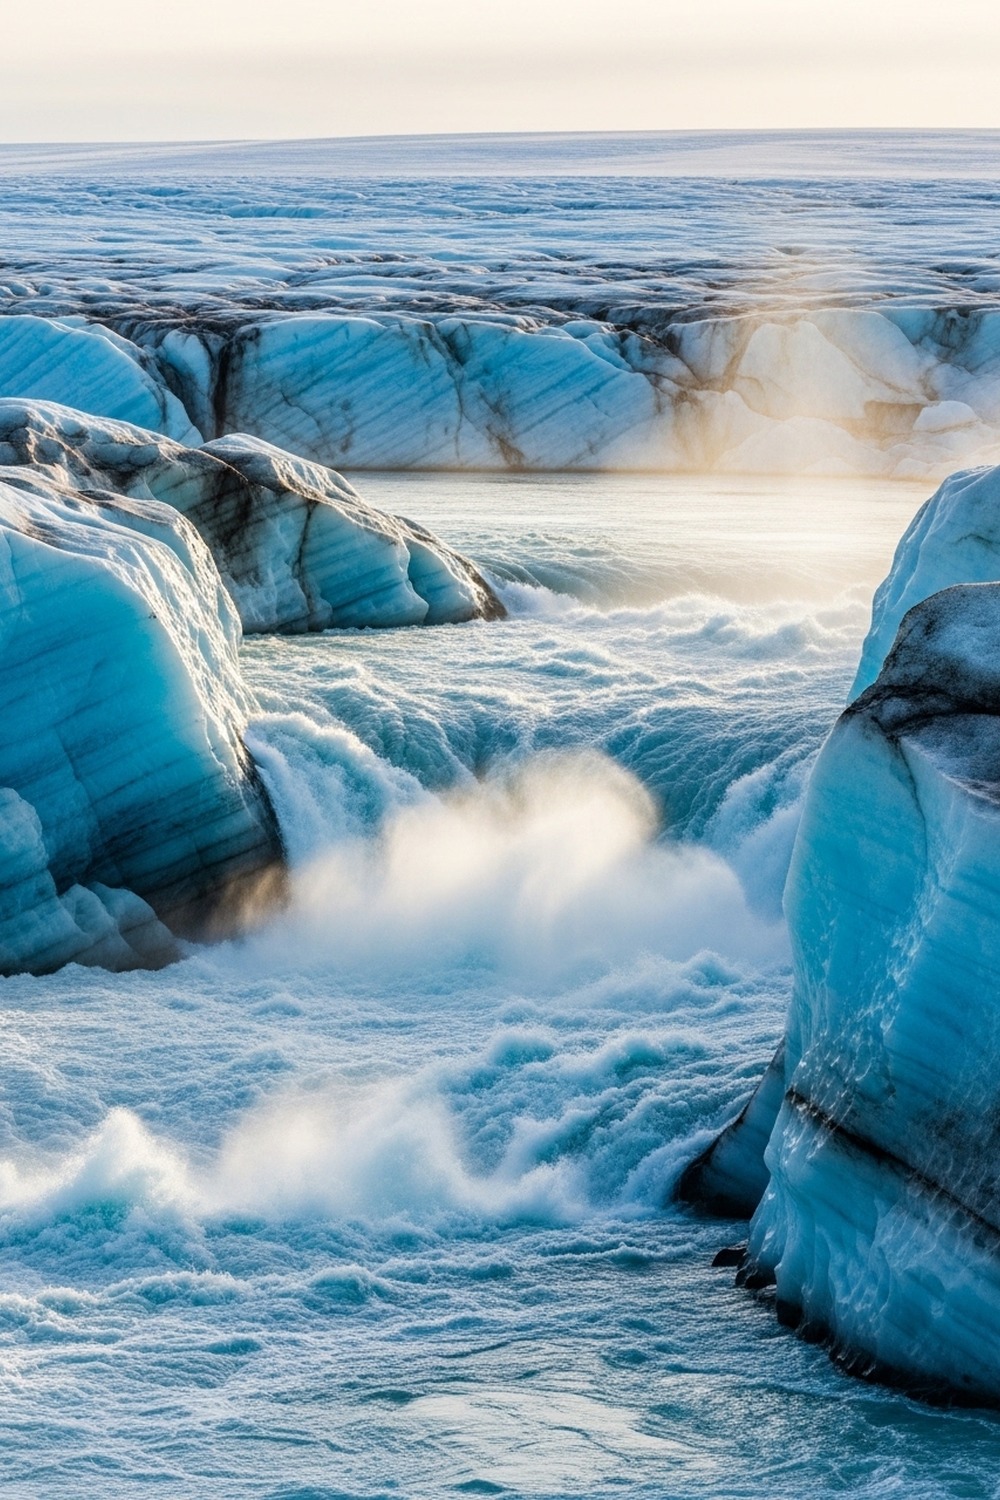
Stand on the edge of Jakobshavn Glacier — Greenland’s fastest-moving and historically its most productive glacier — and the scale becomes visceral. The calving front thunders. Icebergs the size of apartment blocks rotate slowly into dark water. It’s not peaceful. It never was.
Ice Loss Cascades Through Every Living System
Why does this matter beyond the Arctic? Because the Greenland ice sheet’s retreat initiates a chain of ecological and physical consequences that travel to every corner of the connected Earth. Consider what happened in Yellowstone when a keystone species was removed — the cascading disruption reshaped rivers, forests, and food webs across an entire ecosystem. When ice retreats, the same logic applies. If you’ve read about how the return of wolves to Yellowstone literally changed the course of rivers, you already understand how removal of a single element can rewire an entire landscape. Greenland is doing the same thing — at planetary scale.
Permafrost across Siberia, Alaska, and northern Canada is thawing as Arctic temperatures rise roughly four times faster than the global average. Beneath the thawing ground lies methane — a greenhouse gas roughly 80 times more potent than carbon dioxide over a 20-year window (researchers actually call this the GWP20 metric) — locked in sediments that haven’t been warm since the Pleistocene. The National Snow and Ice Data Center in Boulder, Colorado reported in 2022 that Arctic sea ice extent had fallen to its sixth-lowest recorded minimum since satellite measurements began in 1979. When that methane escapes, it accelerates the very warming that released it.
Glaciologists call this a feedback loop. Every degree of warming thaws more permafrost, releases more methane, raises temperatures further, and accelerates the Greenland ice sheet melting already underway. The loop doesn’t care about political cycles.
What the Gulf Stream’s Slowdown Actually Means
The Atlantic Meridional Overturning Circulation — the vast conveyor belt of ocean current that includes the Gulf Stream — has slowed to its weakest state in at least 1,600 years, according to a landmark 2021 study published in Nature Geoscience by researchers at the Potsdam Institute for Climate Impact Research. Freshwater pouring off the Greenland ice sheet dilutes the salty North Atlantic water that normally sinks and drives the circulation southward. Less sinking means less flow. Less flow means less heat delivered to Northern Europe, more intense storms in the North Atlantic, and shifted monsoon patterns across West Africa and South Asia. The implications aren’t regional. They’re global.
A weaker Gulf Stream doesn’t just cool Europe — it also pushes the Intertropical Convergence Zone southward, the belt of rainfall that feeds the Amazon. A disrupted AMOC could reduce rainfall over the world’s largest rainforest, stressing a biome already losing ground to deforestation. Greenland ice sheet melting, in other words, reaches into the Amazon basin. The atmosphere doesn’t respect borders, and neither does the ocean.
When the evidence points in every direction at once and still converges on the same conclusion, dismissing the pattern stops being skepticism and starts being something else entirely.
Researchers at the National Oceanography Centre in Southampton have been deploying moored instruments in the Atlantic since 2004 — the RAPID array — capturing real-time AMOC data that didn’t exist a generation ago. The trend they’re measuring is unambiguous. The slowdown is real, and it’s not reversing.
Greenland Ice Sheet Melting Rewrites Sea Level Projections
For years, the Intergovernmental Panel on Climate Change’s sea level projections were considered the authoritative upper bound. By 2021’s Sixth Assessment Report, those projections had already been revised upward. Scientists at institutions including NASA’s Jet Propulsion Laboratory and the Alfred Wegener Institute in Germany were warning that ice sheet dynamics — particularly from Greenland and Antarctica — remained the largest source of uncertainty in the models. The IPCC’s high-end scenario for 2100 now includes the possibility of over one meter of global sea level rise, driven heavily by Greenland ice sheet melting, enough to threaten hundreds of millions of people in coastal cities from Miami to Mumbai.
Marine ice sheet instability is the physics inside those projections that matters more than the headline numbers. Warm ocean water undercuts glaciers from below, causing them to retreat into deeper water and accelerate — and once triggered, the process can become self-sustaining. It doesn’t need continued warming to continue. Jakobshavn, Helheim, and Kangerdlugssuaq glaciers in Greenland all sit in configurations where this is already active. The clock isn’t theoretical.
Field teams from the University of Copenhagen have been conducting airborne radar surveys of Greenland’s bedrock since 2009 — mapping the hidden topography beneath the ice that will determine how retreat unfolds. The maps they’ve produced show valleys and fjords that funnel glaciers directly toward the sea. Gravity does the rest.
The Billion People Who Drink From Shrinking Glaciers
Greenland commands the largest headlines, but it’s not the only ice system in crisis. The Hindu Kush Himalayan glaciers — sometimes called the Third Pole — hold the largest concentration of freshwater outside the polar regions. According to the International Centre for Integrated Mountain Development’s 2023 Hindu Kush Himalaya Assessment, these glaciers could lose up to 75 percent of their volume by 2100 under high-emission scenarios. More than 1.65 billion people across Pakistan, India, Nepal, Bangladesh, and China depend on glacier-fed rivers for drinking water, irrigation, and hydropower — an overlap between climate physics and human survival that has no clean solution.
Glacial melt initially increases river flow as ice reserves drain. That sounds like relief. It isn’t. Downstream farmers and cities adapt to that elevated flow, building infrastructure and agricultural patterns around a water supply that is fundamentally temporary. When glaciers shrink below the threshold that sustains summer melt, river flow collapses — often within one or two generations. The Indus River basin, which irrigates the largest contiguous irrigation system on Earth, runs through some of the driest terrain in Asia. Remove the glacier contribution and the arithmetic becomes brutal.
And the communities most dependent on glacier water have the least capacity to replace it — a compounding injustice that runs alongside the physical one.
In the Hunza Valley of northern Pakistan, farmers have watched specific glaciers that fed their orchards and wheat fields retreat by kilometers within a single lifetime. It’s a grandfather pointing to bare rock where his father saw ice. The data confirms what communities already know — and have known for decades longer than the satellites.
How It Unfolded
- 1992 — Satellite altimetry measurements of the Greenland ice sheet begin in earnest, establishing the baseline against which all future loss would be measured.
- 2002 — NASA’s GRACE satellite mission launches, allowing scientists to measure ice mass loss via gravitational changes for the first time with continental-scale precision.
- 2012 — A single summer melt event covers 97 percent of the Greenland ice sheet surface — an extent not seen in over 120 years of recorded observation — signaling a threshold had been crossed.
- 2023 — Updated IMBIE assessments confirm Greenland’s total mass loss since 1992 has reached 4.7 trillion tons, with the pace of loss in the 2010s running six times faster than the 1990s.
By the Numbers
- 4.7 trillion tons of ice lost from the Greenland ice sheet between 1992 and 2023 (IMBIE consortium, Nature, 2023)
- 1.7 million km² — the total area covered by the Greenland ice sheet, approximately 80 percent of Greenland’s land surface
- Six times faster — the rate of Greenland ice loss in the 2010s compared to the 1990s, per the IMBIE 2019 assessment
- 1,600 years — the period over which the Atlantic Meridional Overturning Circulation is now at its weakest recorded state (Potsdam Institute, 2021)
- Up to 7.2 meters — the total potential sea level rise if the entire Greenland ice sheet were to melt completely, representing the upper physical ceiling of the risk
Field Notes
- In 2019, a study by the Danish Meteorological Institute found that Greenland’s ice loss that year alone — around 532 billion tons — was enough to raise global sea levels by 1.5 millimeters in a single summer, the highest single-year loss recorded at that time.
- Across the Greenland ice sheet surface, a broad band known as the dark zone has turned dramatically darker over recent decades due to algae growth and dust accumulation. Darker surface means more solar radiation absorbed, which means faster melt from the top down. It’s a feedback mechanism growing inside the ice itself.
- Meltwater lakes that form on the ice sheet surface don’t just sit there — they can drain to the glacier’s base through cracks called moulins in a matter of hours, lubricating the bedrock and causing sections of the glacier to slide toward the sea more rapidly.
- Scientists still cannot predict with confidence the exact timing of marine ice sheet instability thresholds — whether Greenland’s outlet glaciers will retreat rapidly and irreversibly within decades or stabilize temporarily. The models diverge at precisely the moment the stakes become highest.
Frequently Asked Questions
Q: How fast is the Greenland ice sheet melting compared to previous centuries?
Greenland ice sheet melting has accelerated dramatically since the mid-twentieth century. Ice cores extracted from the sheet’s interior show that current melt rates are unprecedented in at least the last 350 years, and likely in the last 7,000 years. The IMBIE consortium confirmed that the pace of loss increased sixfold between the 1990s and the 2010s. At current rates, Greenland alone contributes roughly 0.7 millimeters of sea level rise per year — a figure that was a fraction of that just three decades ago.
Q: Can the Greenland ice sheet ever recover once it starts melting?
Recovery is theoretically possible but practically constrained by timescales far beyond human planning horizons. Ice sheets grow slowly — accumulating snowfall over millennia — but can lose mass rapidly through surface melt and glacier calving. More critically, some glaciological processes, particularly marine ice sheet instability, may become self-sustaining once initiated. Even if global temperatures were stabilized today, the ice sheet would continue adjusting to heat already absorbed by the ocean. Meaningful recovery, on current trajectories, would require centuries to millennia under significantly cooler conditions.
Q: Does Greenland ice sheet melting affect weather outside the Arctic?
A common misconception is that Greenland’s ice loss is primarily an Arctic issue. Freshwater discharge from the ice sheet disrupts Atlantic Ocean circulation patterns — including the Gulf Stream — which regulate weather across Europe and rainfall across the tropics. Greenland ice sheet melting has been linked to weaker Atlantic storm tracks, shifts in the European jet stream, and potential disruption of West African monsoon systems. The ocean is the connective tissue, and Greenland’s meltwater is already altering it at measurable scales.
Editor’s Take — Alex Morgan
What strikes me most about this story isn’t the size of the numbers — it’s the speed. Climate systems that scientists once assumed would respond gradually over centuries are responding in decades. The AMOC slowdown. The permafrost methane feedback. The darkening of Greenland’s surface. Each of these individually would be a significant story. The fact that they’re all happening simultaneously, and reinforcing each other, is something our normal frameworks for risk aren’t built to process. That gap — between what the data says and what we’re willing to act on — might be the most consequential distance on Earth.
The ice holds memory. It records every summer, every volcanic winter, every industrial exhale in its crystalline layers — a natural archive that scientists can read backward tens of thousands of years. What it’s recording right now is something it hasn’t recorded before: a pace of change driven by a single species in a geological eyeblink. The people who will stand on these coastlines in fifty years won’t need to read the ice to understand what happened. They’ll be living it. The only real question left is how much of the record we choose to write in the time we still have.
Illustrations are AI-generated. Article fact-checked and human-edited. Our editorial standards.